1. Concept


The goal of the eye-tracking team was to scientifically prove if there are any intercultural differences or similarities between Germans and Indonesians when it comes to watching German and Indonesian advertisements.

The concept for the project was to first select different advertisements that were shown to Indonesians as well as Germans while using eye-tracking technology. After that, the plan was to analyze the data from the eye-tracking evaluation and then to develop corresponding infographics. The focus of this team was on the differences and similarities in the viewing behavior between the two countries. The final result consisted of four infographics, that present the data in visually attractive illustrations.

2. Progress

3. Scribbles

4. Analyzing the gathered data

5. Questionnaire


The development of the strategy was a major part of the whole design process. In the beginning, we decided which advertisements would be appropriate and worthwhile for the test persons to track. We made the decision concerning what advertisements we chose based on their duration, the number of interesting scenes and the level of cultural representation. Nine Indonesians and nine Germans were chosen with an age range from 18 to 30 and from both sexes. A large number of data was used to verify whether there is an intercultural difference in the viewing behavior. We chose the two German advertisements for Mercedes and BVG, and the two Indonesian videos for Shopee and Sprite. The second step was to collect as much data possible evaluating 18 test persons using the eye-tracking system, which is becoming more and more popular in the design and marketing field.

This technology can track the movement of one’s eye while a person watches the advertisement. It provides many different evaluation methods of analysis and visualization afterwards. All the data were imported in an excel sheet with mathematically calculated percentages. Since that data still consisted of raw numbers, the team started illustrating infographics that converted the numbers into easily recognizable, attractive and playful data visualizations. The infographics visualize mainly the items that had a representative difference in the viewing behavior of the German and Indonesian test persons. The final results were four infographics for each advertisement.

6. Conclusion


One obvious characteristic is that Indonesian and German advertisements are representative of their own culture. While the selected german advertising videos look more professional and have an international high-class mainstream style, the Indonesian videos are more playful, creative and relatively professional as well. The reason for that is the different mindset that these two cultures have when it comes to their specific expectations of entertainment. The Indonesian culture is much more diverse (since it consists of 17 thousand islands) and difficult to analyze. The German culture is predictable, organized, structured but more emotionally distant.

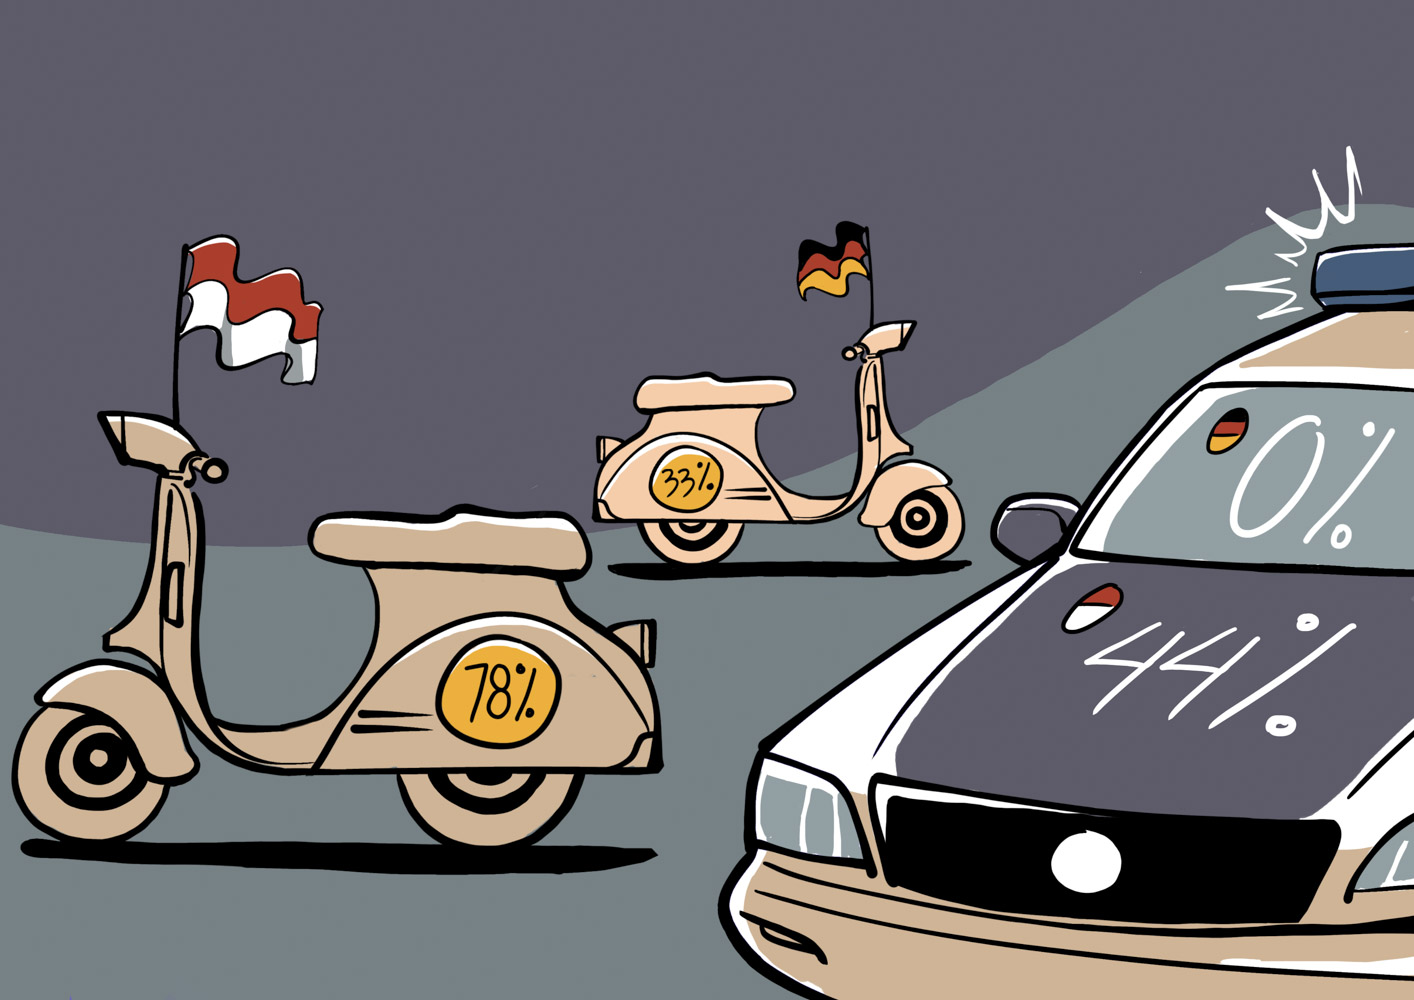
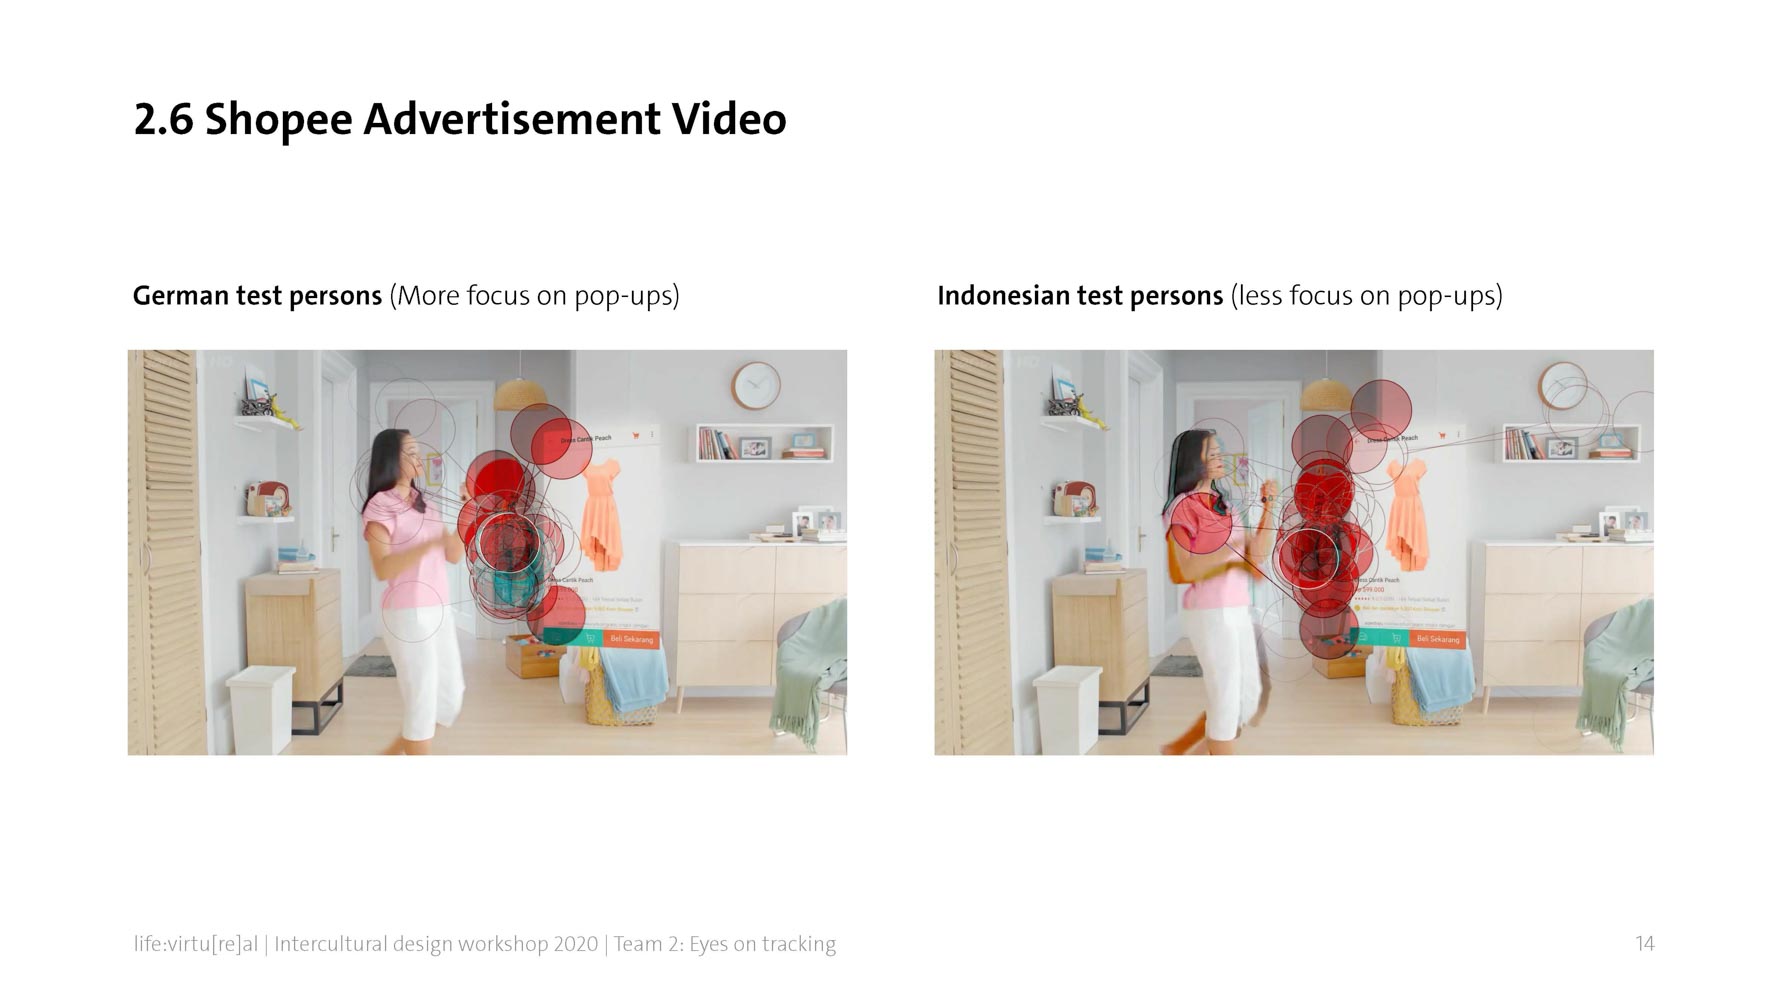
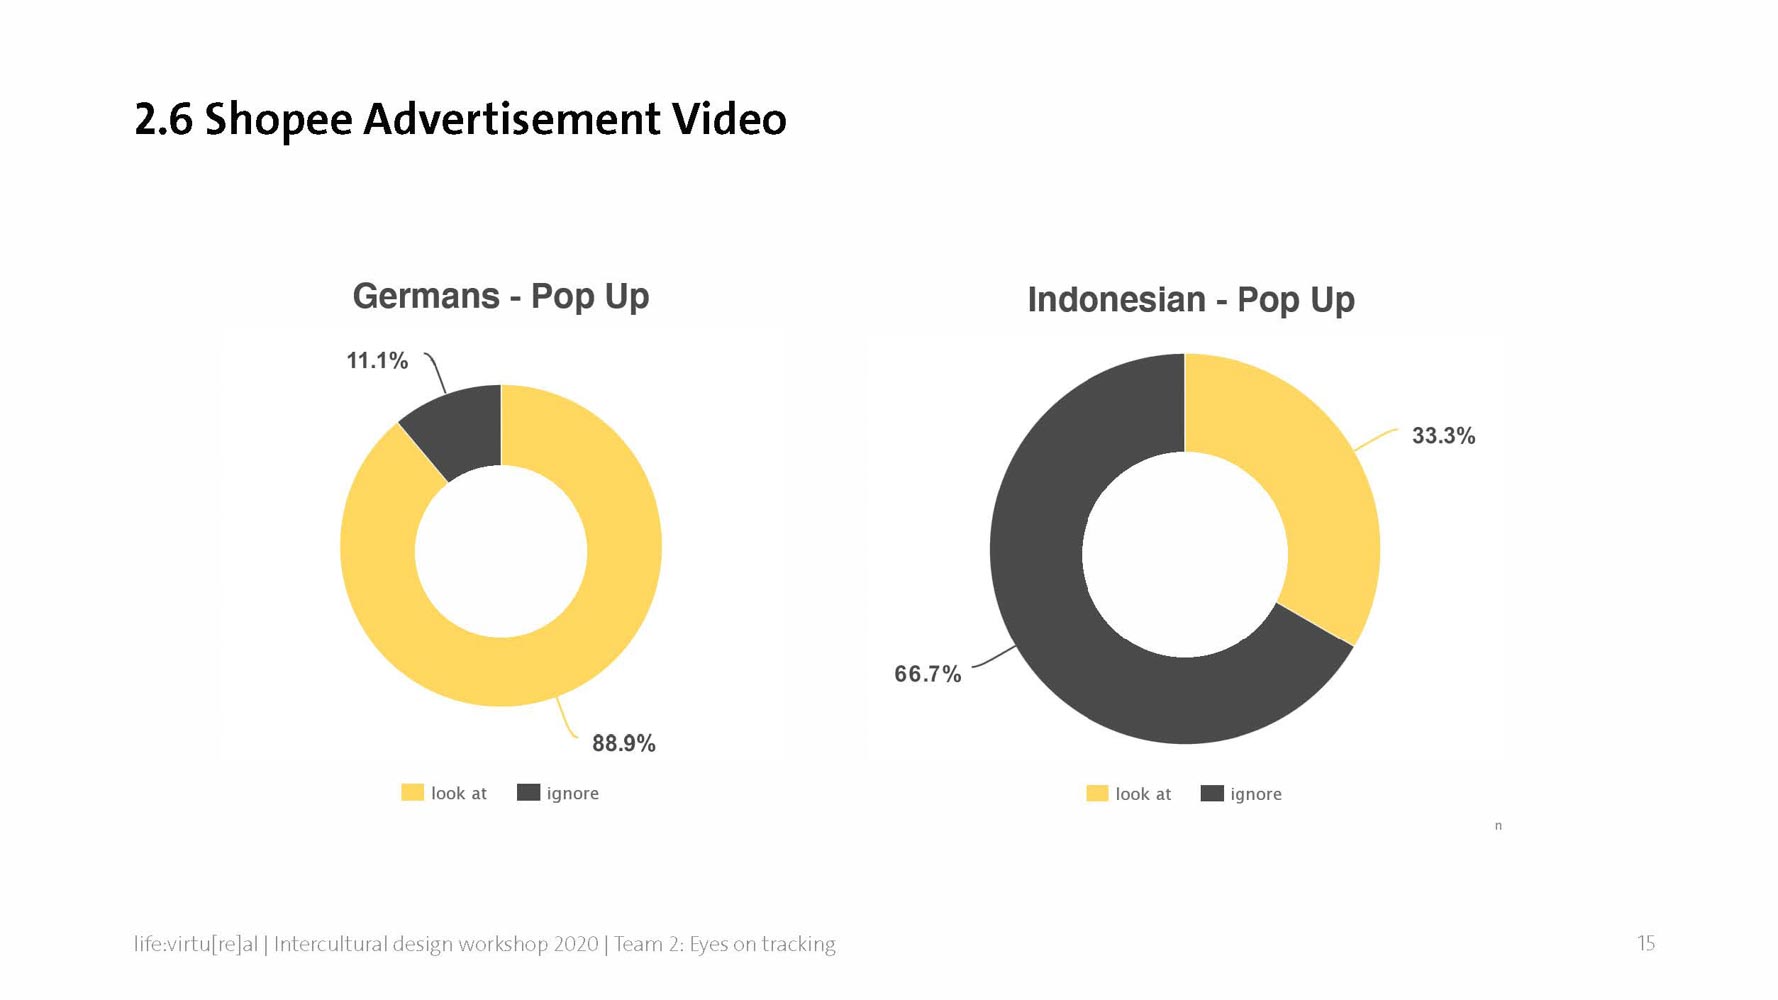
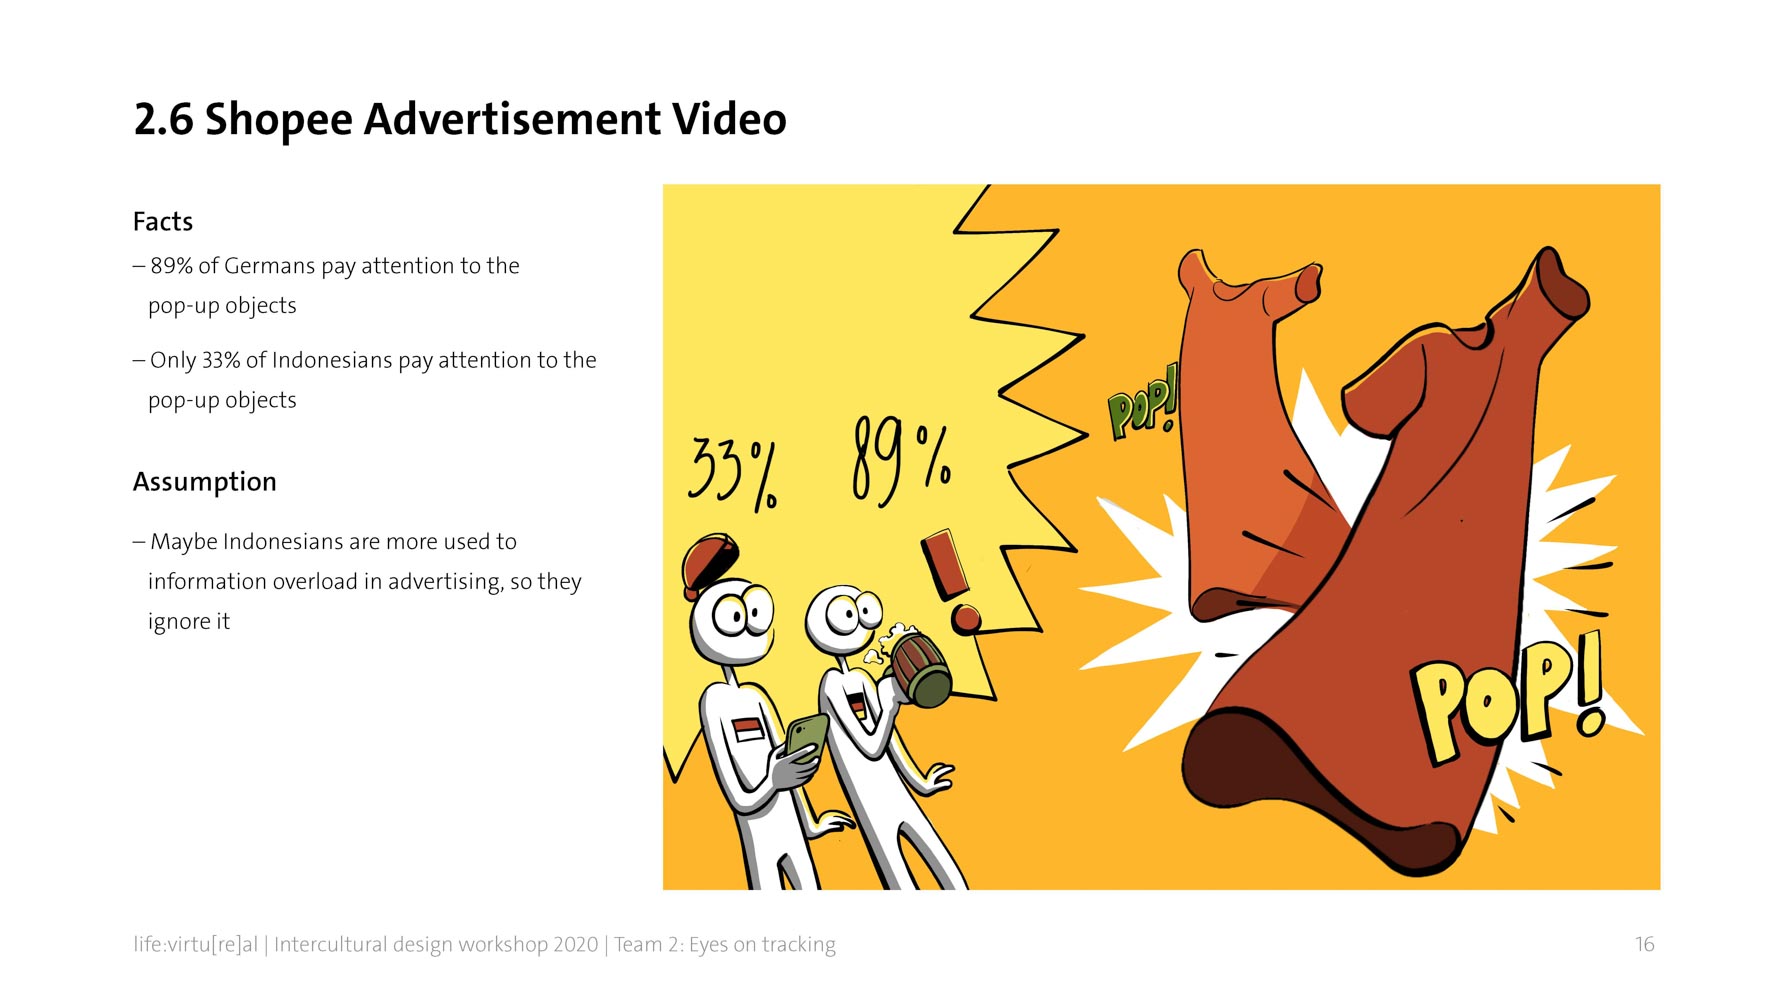
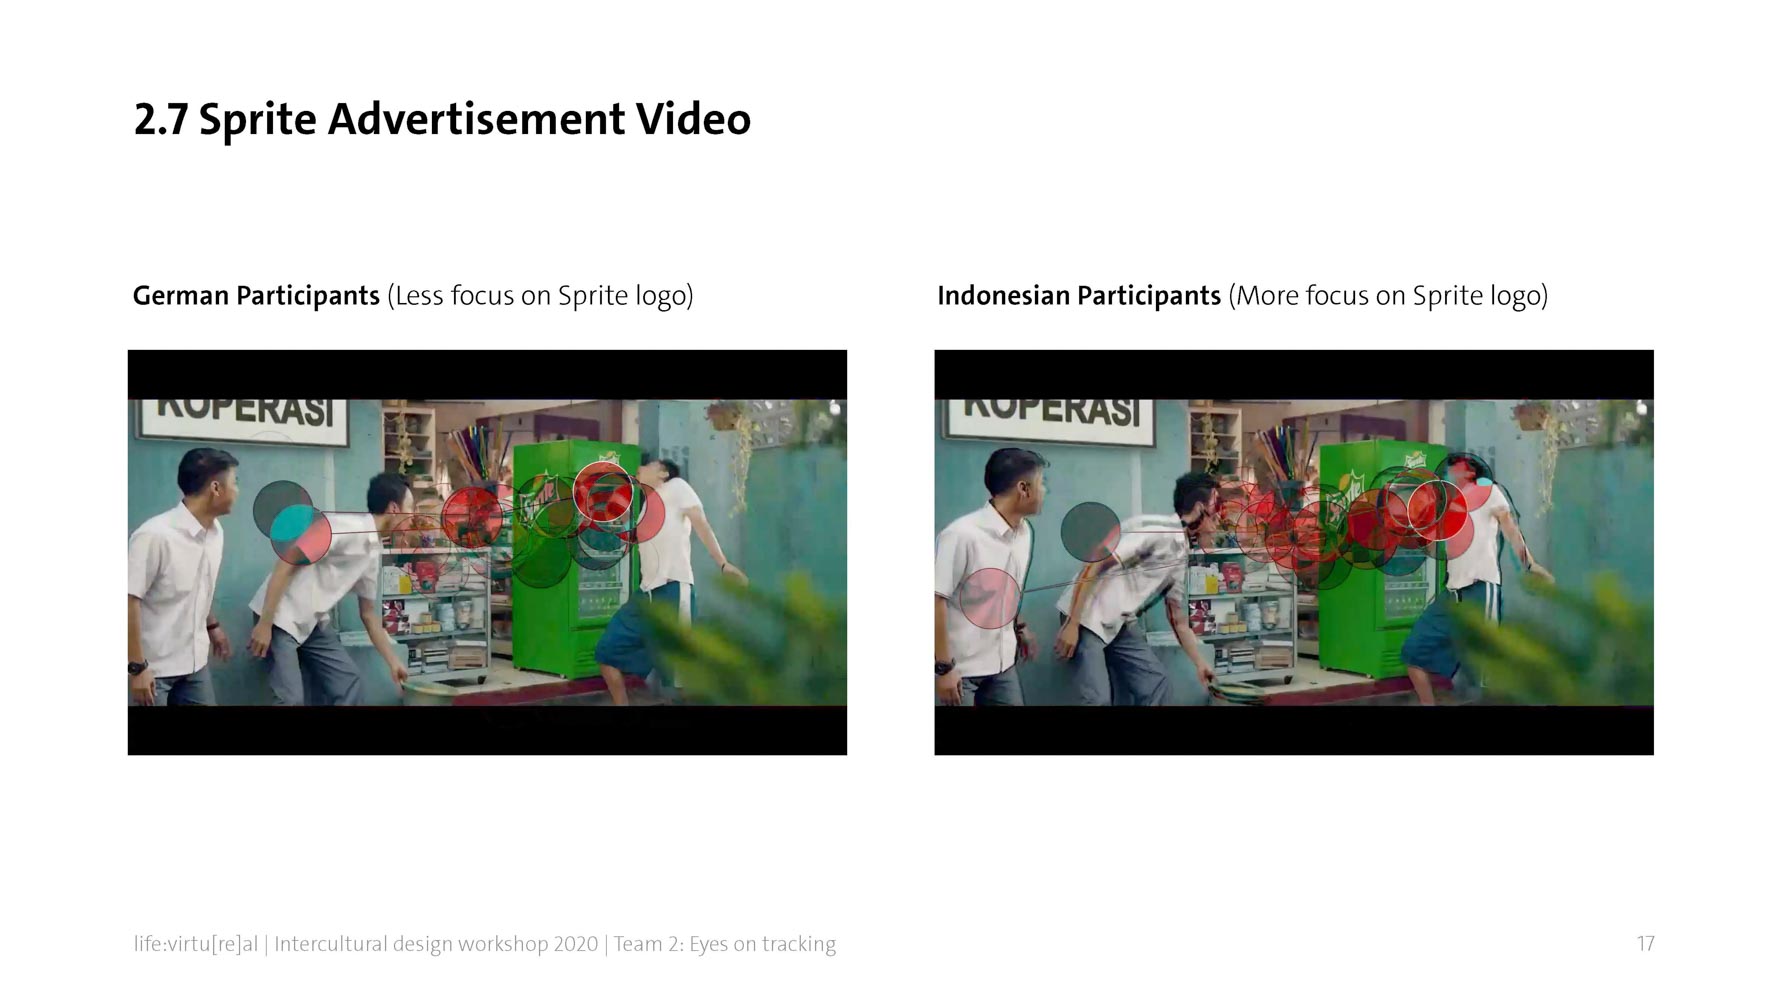
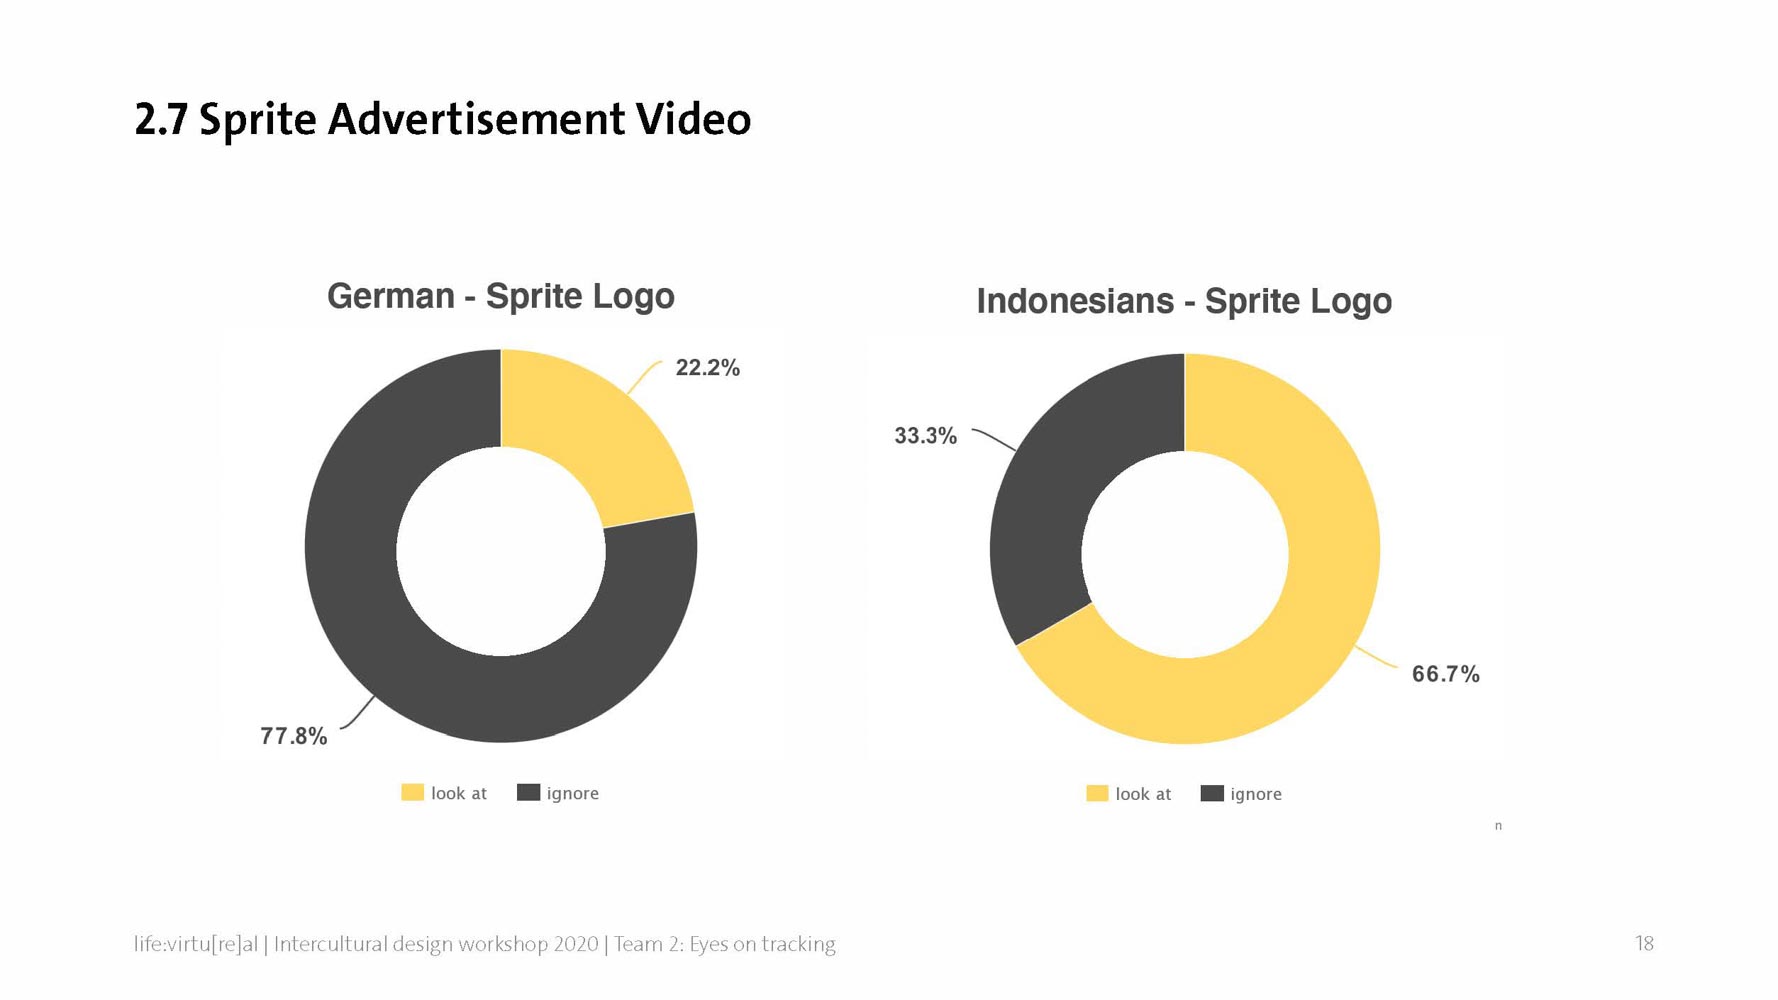
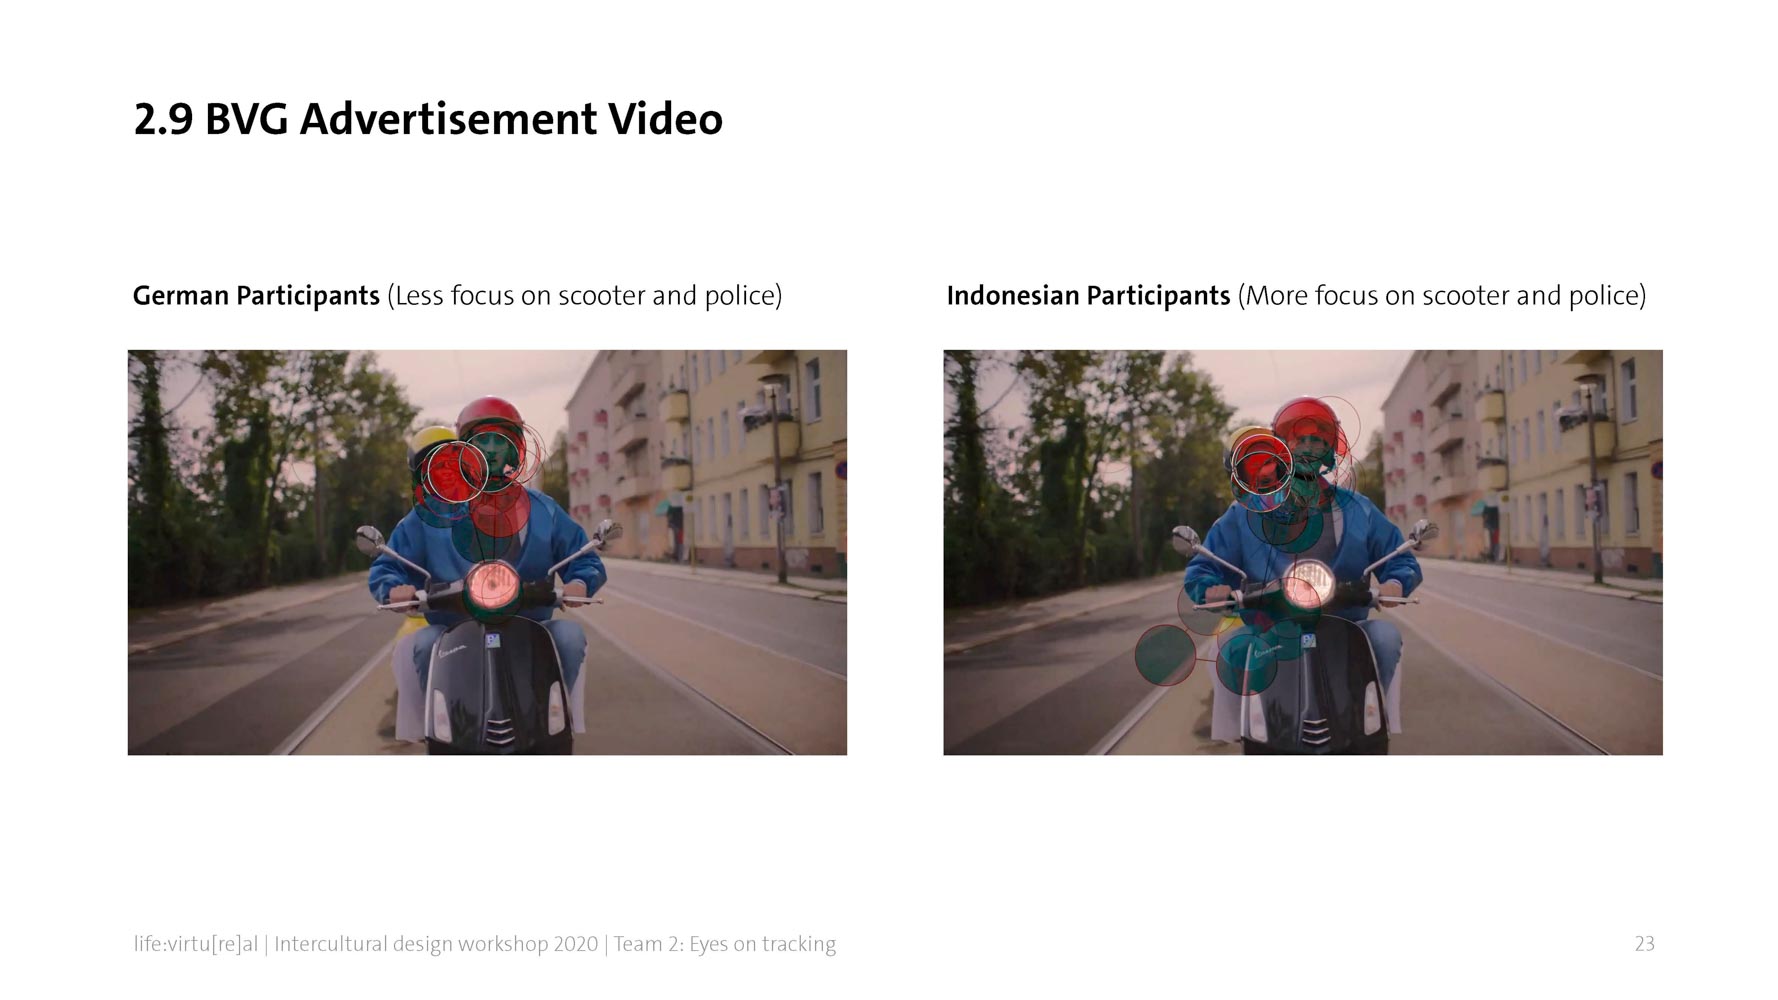
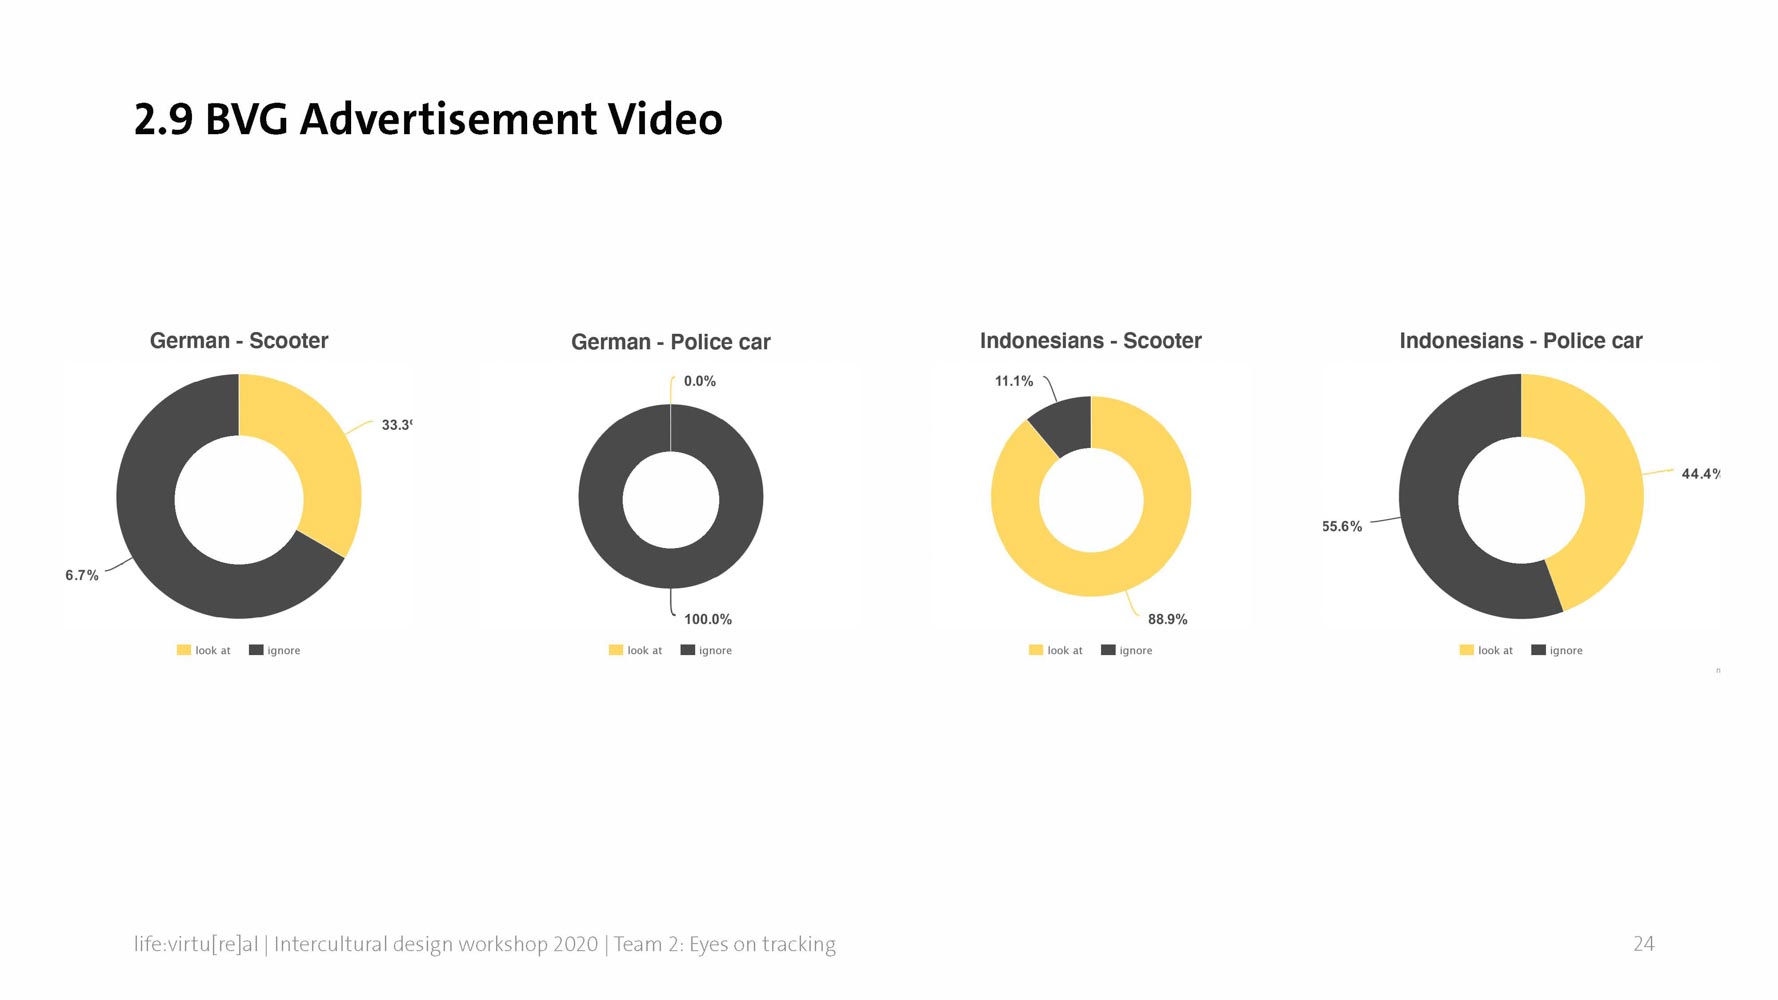
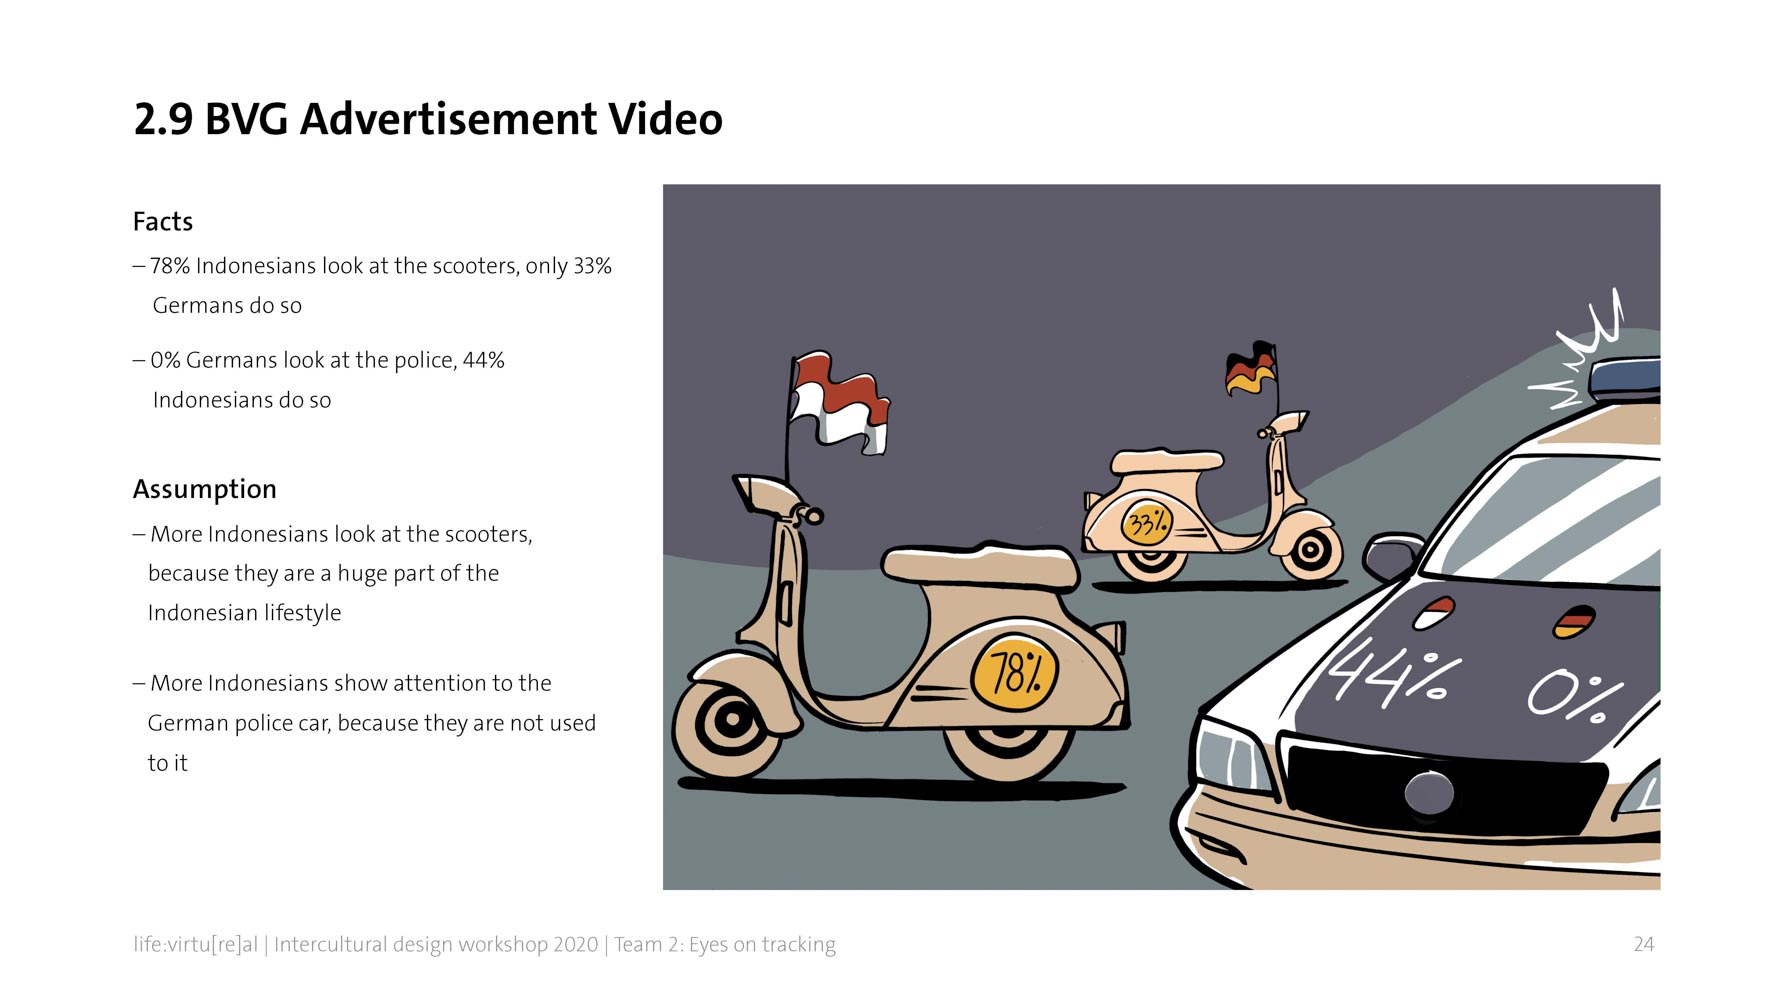
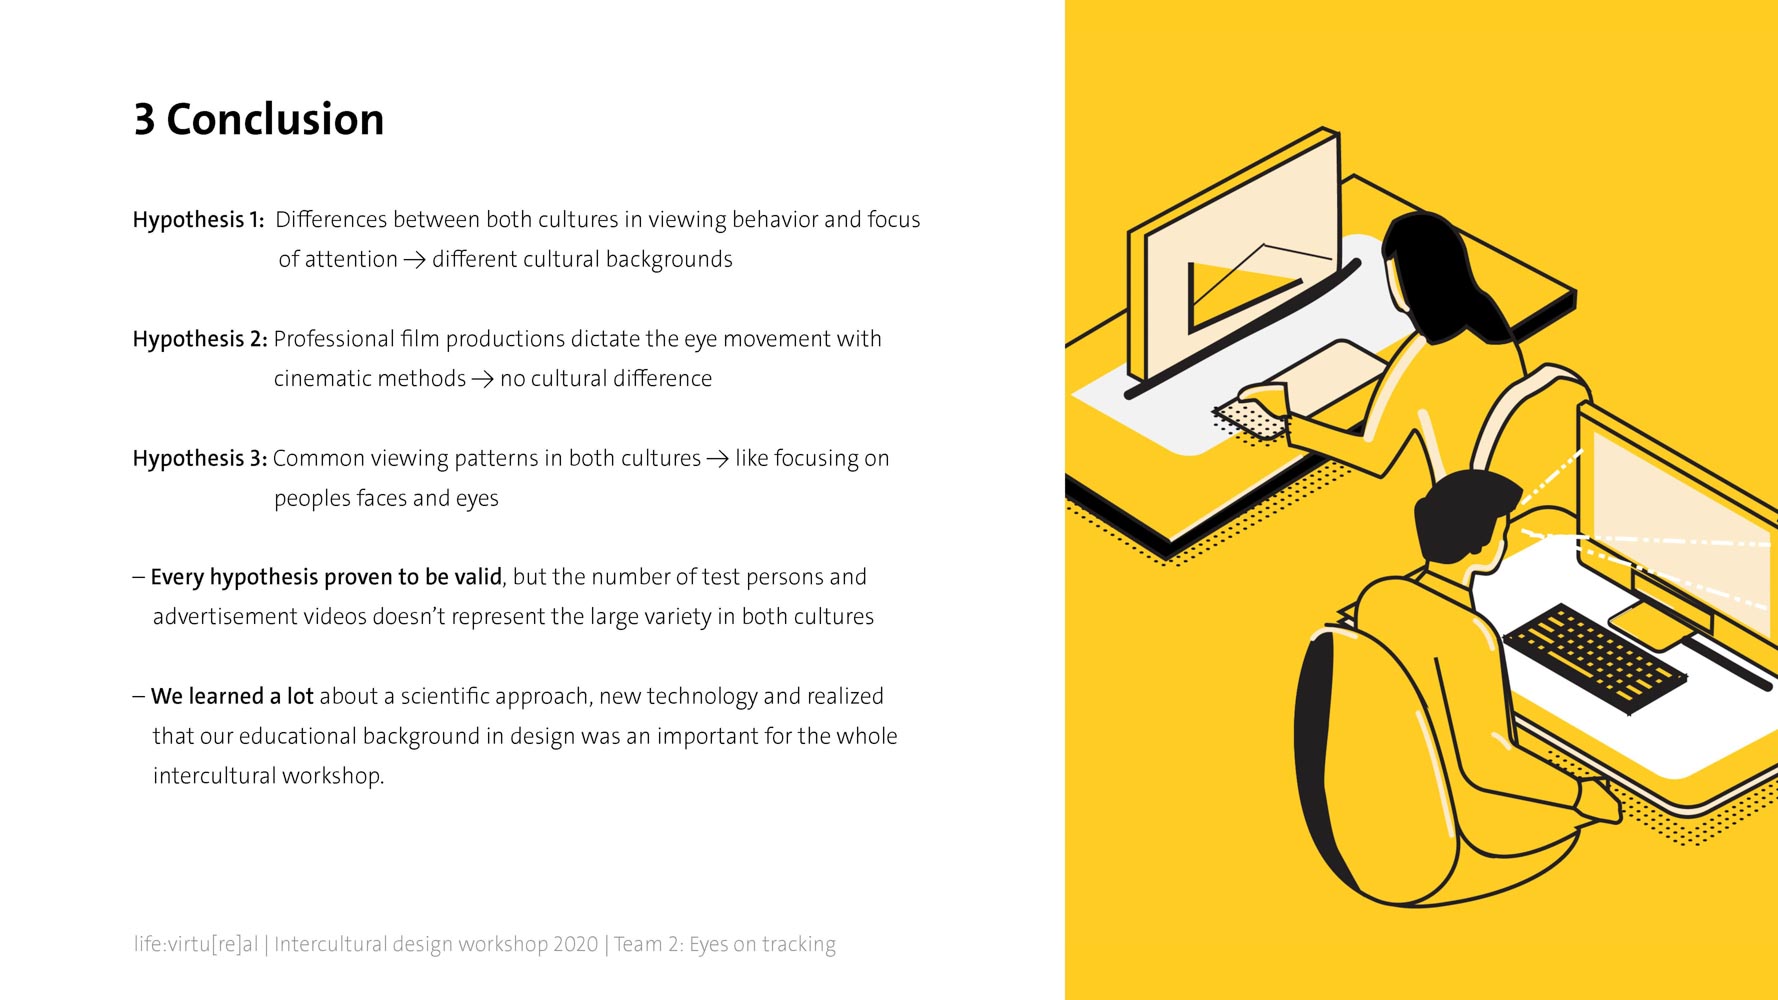
First hypothesis: There are differences between the two cultures in viewing behavior and focus of attention. We assumed that because of the different cultural backgrounds mentioned before. 
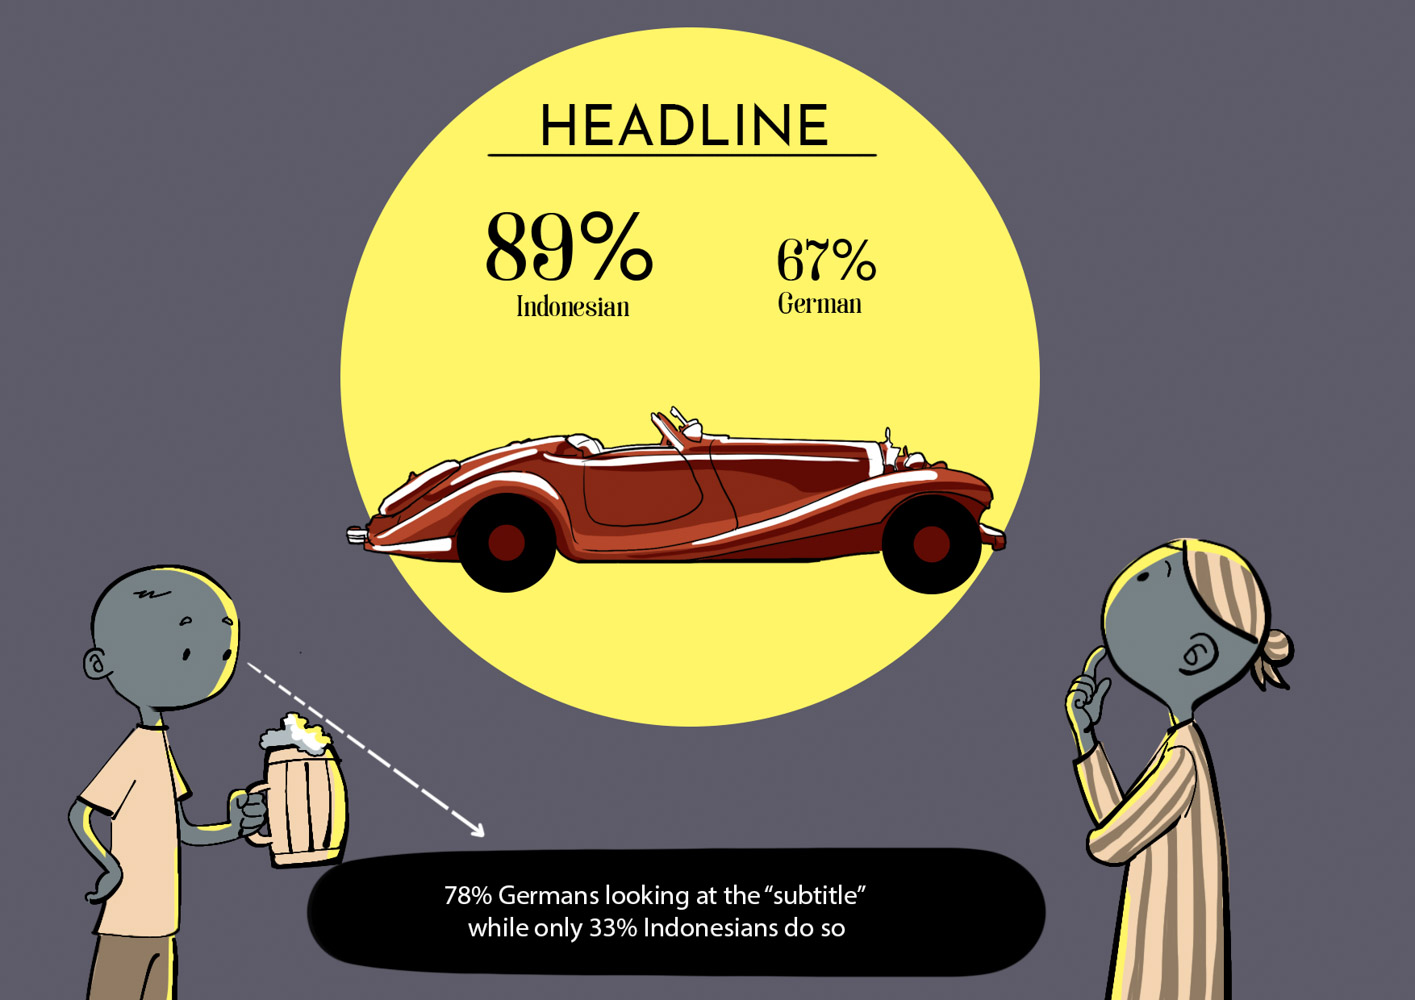
The second hypothesis: In professional productions, the eye movement of the test persons is dictated by the film production with cinematic methods. The third hypothesis: There are common viewing patterns in both cultures, such as focusing on peoples’ faces and eyes Every hypothesis was proven to be valid, but we know that the number of our test persons is too small. Also, the number of advertisement videos doesn’t represent the large variety in both cultures. 
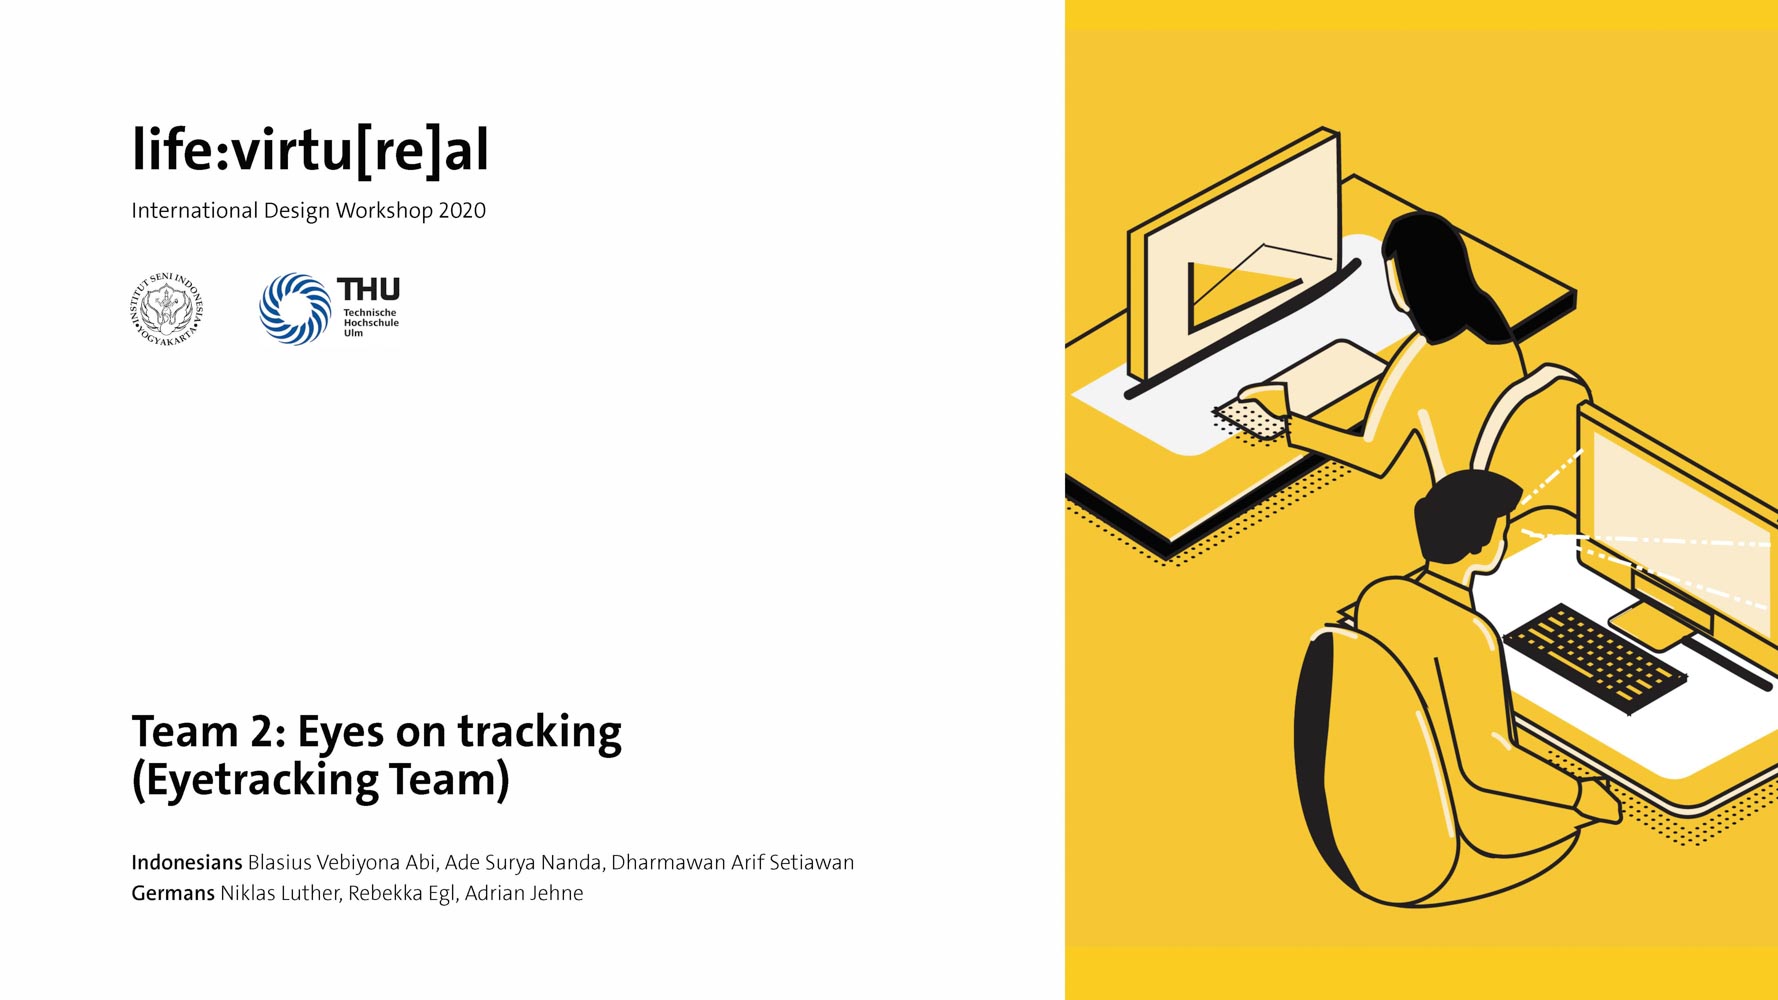
The benefit for us was, to learn a lot about a scientific approach while using new innovative technology. The project was highly complex. We realized that our educational background in design was an important prerequisite for the whole intercultural workshop.